ML Playgrounds: Explanations in Steps, a Shared Glossary and Definitions on Hover
All 13 playgrounds are rebuilt as numbered steps, with every chart preceded by an explanation; 71 terms are gathered into a shared glossary, and on the playgrounds a definition pops up when you hover over an underlined word; the precision–recall curve is explained through a falling threshold and the ideal model.
The playgrounds were written as companions to lectures. To someone who remembers the lecture, the captions make sense; to someone who arrives from a search, they do not: terms are used without definitions, and charts appear before anything says what is on them. Over a week the playgrounds received three changes that close this gap: an order in steps, a shared glossary and definitions right in the text.
A playground as a sequence of steps
All 13 playgrounds are rebuilt by one rule: the sections are numbered and come in the order they should be read, and every chart is preceded by a paragraph on what it shows and where it comes from. Take the data-leakage playground. It used to open straight with the final numbers; now it is six steps: the data and the task, how a model is checked, two orders of steps — with the leak and honestly — the result by fold, what got selected, and why noise looks significant.
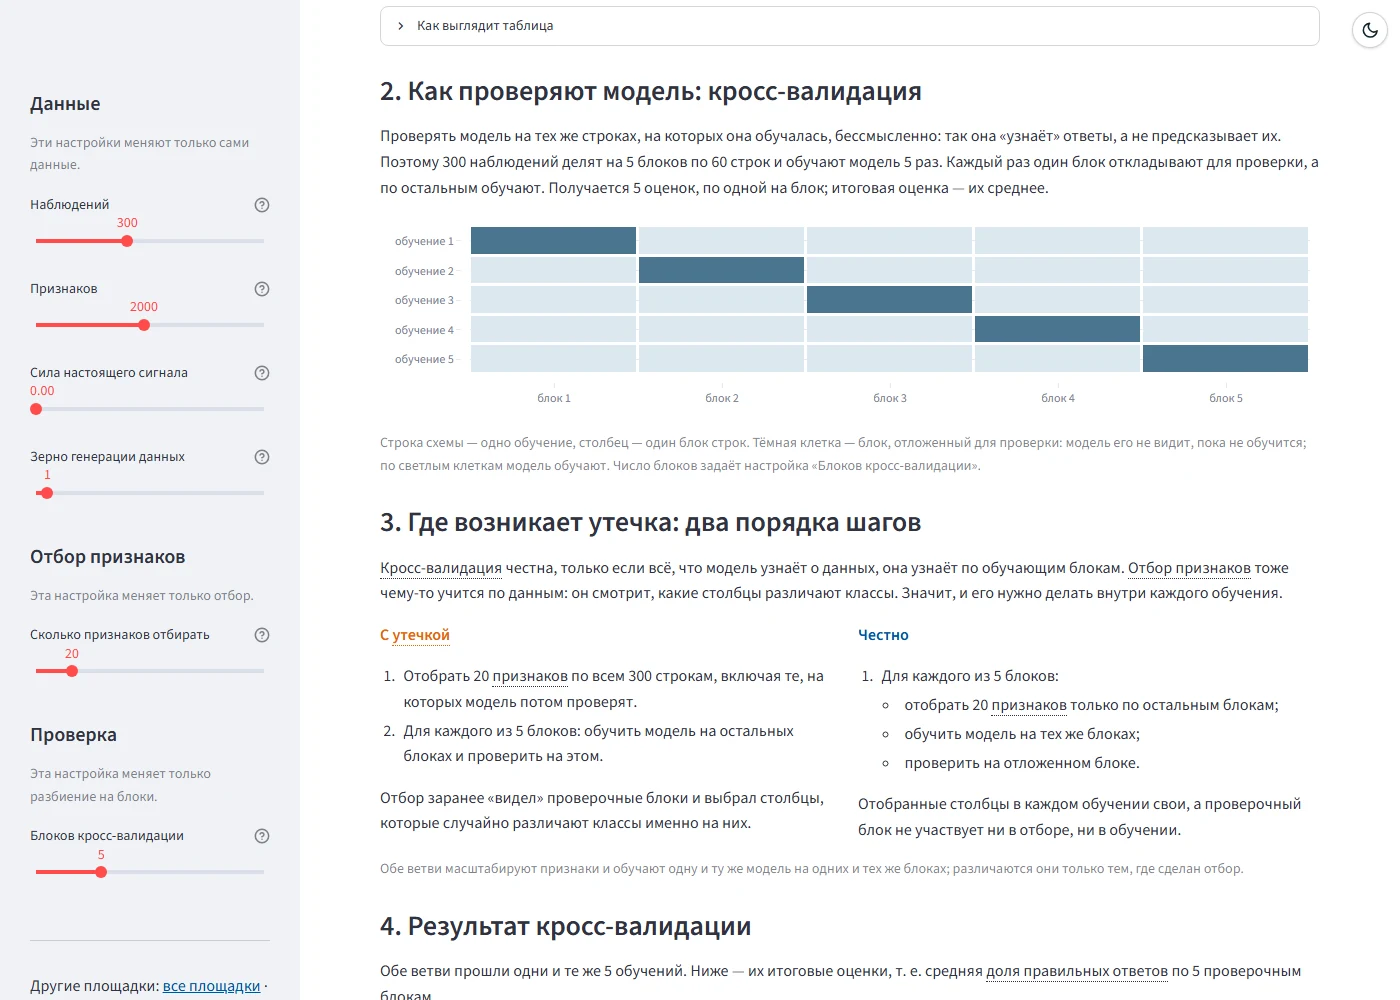
Step two has a new scheme: a row is one training run, a column one fold of rows, and a dark cell the fold held out for checking. A slider sets the number of folds, and the scheme rebuilds with it. Step three puts two orders of steps side by side. With the leak: first select 20 features on all 300 rows, then train fold by fold. Honestly: select the features afresh in every training run, on the training folds only. Both branches scale the features and train the same model on the same folds — they differ only in where the selection is made.
On the other playgrounds the same rule led to rearrangements of their own. The neural network shows the network and the backward pass’s code before training, and the bug picked on the left shows in that code as one replaced line. The task graph starts with the graph and the scheduler’s rules, with the result and the log after them. Data preparation shows the cleaning chain explicitly, step by step. On the text-vectorisation playground accuracy is called the share of correct answers, and the help for the min_df and sublinear_tf parameters is corrected.
A shared glossary
The same ideas turn up on many playgrounds: the share of correct answers on five, cross-validation on four. Two different definitions of one thing confuse more than none, so all the terms live in one dictionary in a shared module. Each has a name, a meaning and, where needed, a formula and a note. The dictionary now holds 71 terms; the last eight added are ones the playgrounds used without a definition: feature, logistic regression, sigmoid, ReLU, cross-entropy, standardisation, placeholder and clustering.
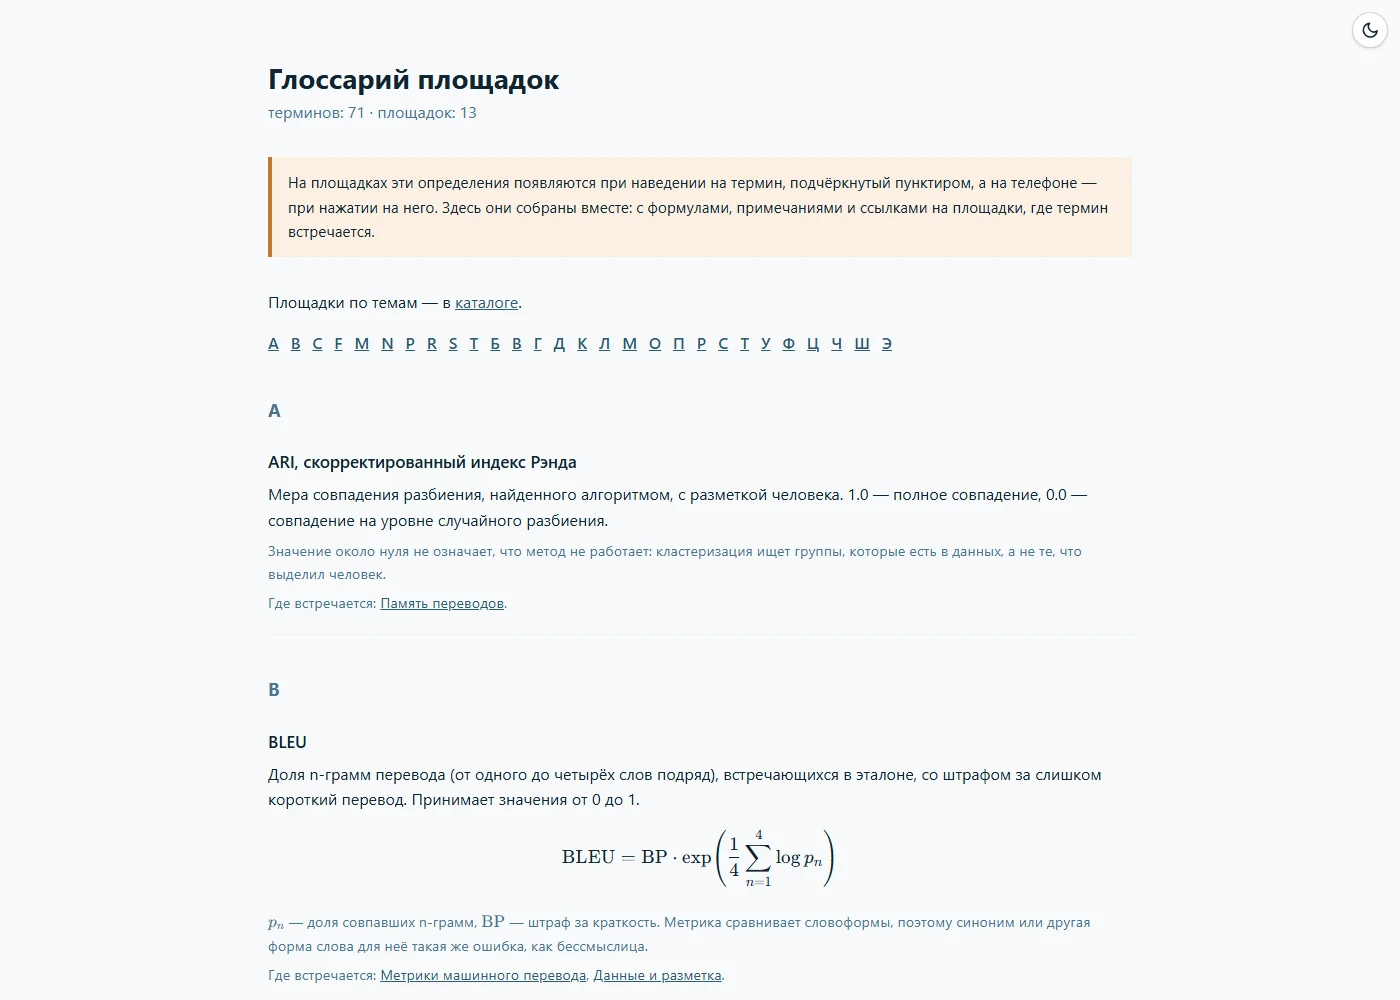
When the site is built, the dictionary becomes a page of its own, the glossary: terms in alphabetical order, Latin first and then Russian, with formulas, notes and a list of the playgrounds where each term appears. A link to it sits in every playground’s sidebar, in the catalog and on the course page.
A definition on hover
On the playgrounds themselves the dictionary works right in the text. The first mention of a term in each block of explanation is underlined with dots; hovering the mouse over it brings up the definition. A phone has no hover, so there a tap opens the definition, and it sits as a strip at the bottom edge of the screen.
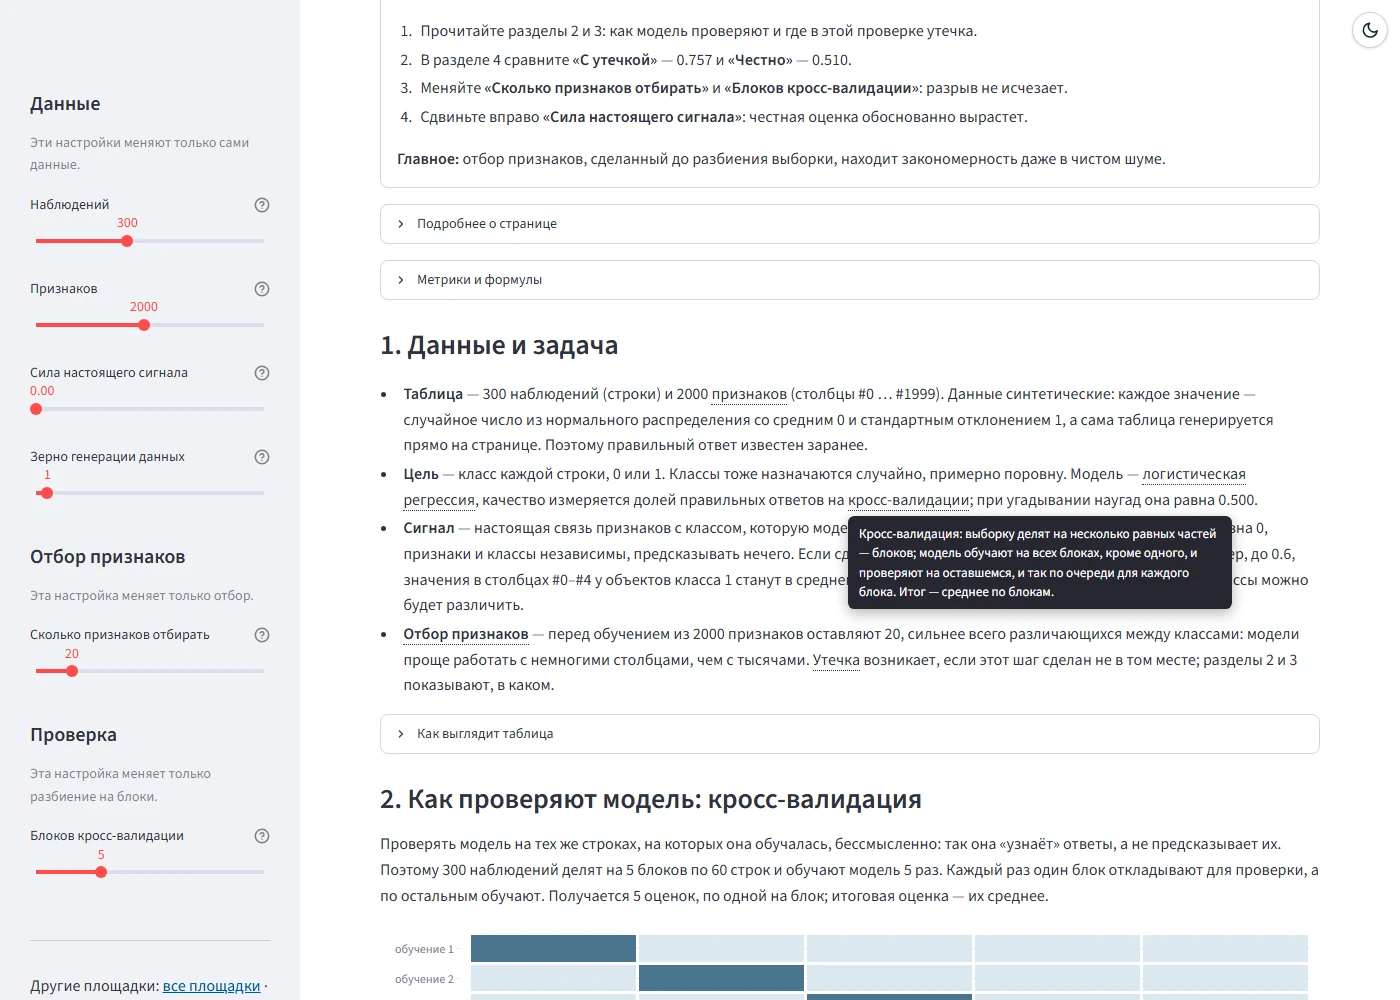
Each playground declares which terms it explains, and only those are looked for. The reason is that one word means different things on different pages: “пропуск” on the data-preparation playground is an empty cell in a table, while on the metrics playground it is a missed failure. Each term has a pattern that catches its inflected Russian forms. Mentions inside bold control names, code, formulas and existing HTML are left alone, so that a tooltip cannot break the markup. Tests check that every term a page asks for is in the dictionary and has a pattern, that only the first mention is underlined, that control names and code stay untouched, and that a page declares its terms before any explanation.
The precision–recall curve
The metric-and-imbalance playground shows a precision–recall curve for three ways of handling the imbalance. Its explanation now says how to read it. The curve is traversed from left to right, lowering the threshold step by step. At a high threshold the model calls only the few most suspicious parts failures and is almost never wrong: recall is low, precision close to 1. The lower the threshold, the more failures are found and the more of the alarms are false.
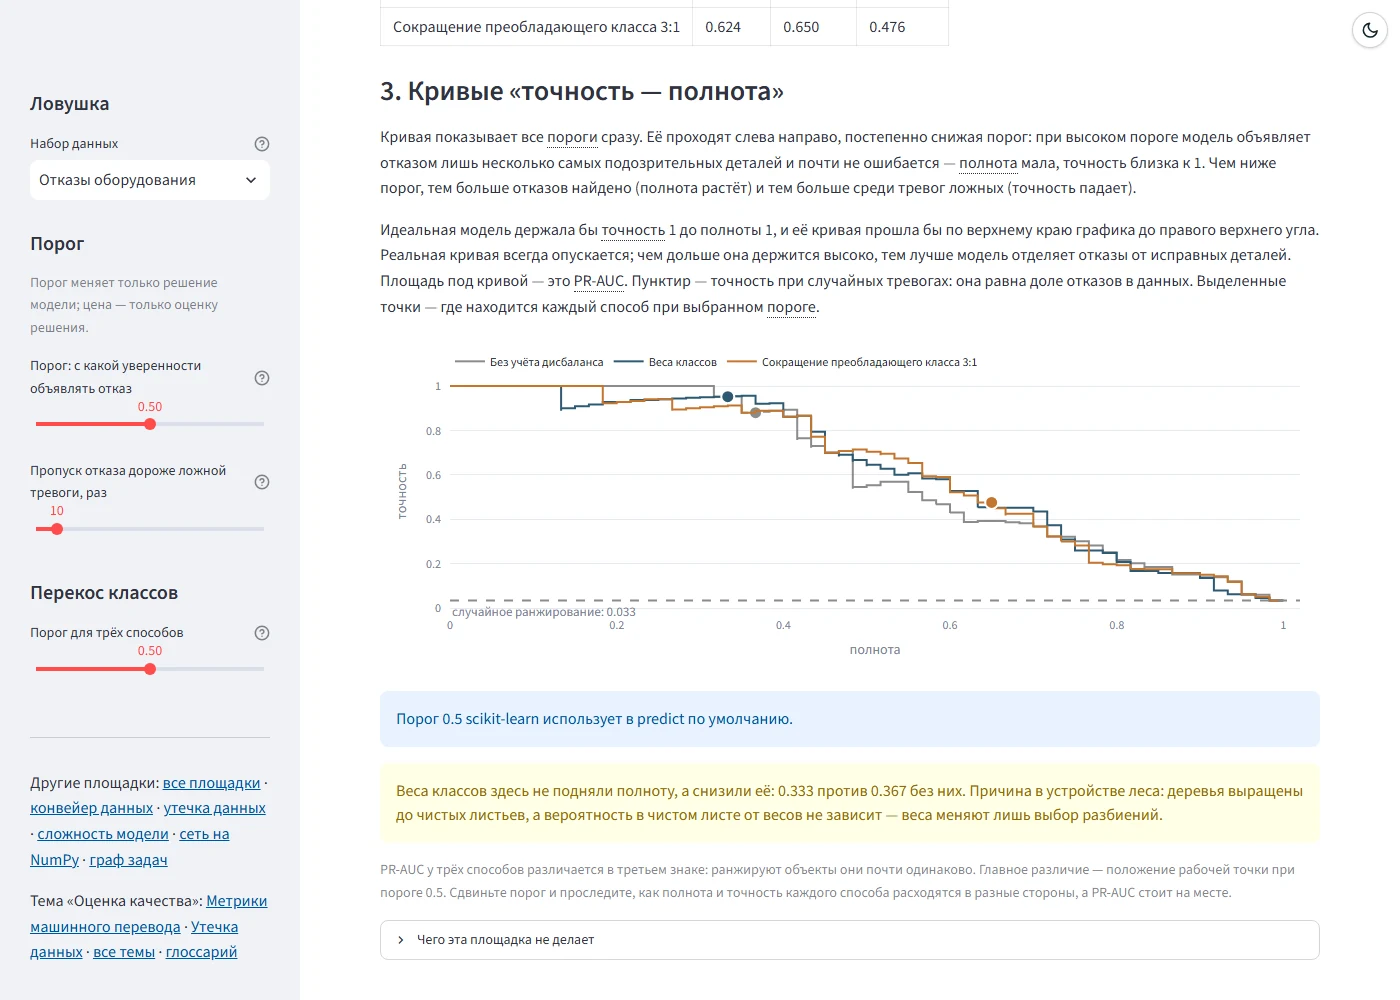
The reference is the ideal model: it would keep precision at 1 right up to recall 1, and its curve would run along the top edge of the plot to the top right corner. A real curve always falls; the longer it stays high, the better the model separates failures from sound parts. The area under the curve is PR-AUC. The dashed line at the bottom is the precision of random alarms, equal to the share of failures in the data; here it is 0.033.
The conclusions under the chart are not written in advance but computed from the data. On this dataset class weights did not raise recall but lowered it — 0.333 against 0.367 without them — and the playground explains why: the random forest’s trees are grown to pure leaves, and the probability in a pure leaf does not depend on the weights.
One more caption for the speed measurement
In the last breakdown the speed measurement learned to cope with the browser’s coarsened clock. Once the numbers became visible, it turned out that the caption under the measurement promised too much: in the browser the dot product was slower than the element-wise version, 556 µs against 379 on a million numbers, although in ordinary Python it is 11 times faster. Now the caption says what was measured here, and the label of the longest bar is no longer cut off by the edge of the chart.
Conclusions
- An explanation helps when it comes before the chart: the reader first learns what they will see and only then looks.
- One dictionary for all pages keeps one idea from getting two different definitions.
- A hover definition has to know the page’s context: the same word can mean different things in different sections.
- A curve is easier to read through movement along it — a falling threshold — and through the ideal case it is compared with.
Availability
The playgrounds open in a browser with nothing to install, and the source code is open.
- Playgrounds: konkin-nikita.ru/gd_learn/topics
- Glossary: konkin-nikita.ru/gd_learn/glossary
- Source code: github.com/nikita-konkin/gd_learn
Tags
More project updates
ML Playgrounds: A Dark Theme for Streamlit Without a Restart, and a Mistake the Highlighting Found
A theme switch on every page of the site that repaints the Streamlit playgrounds without restarting Python; an explanation of the data on the data-leakage playground, where high...
ML Playgrounds: A Second Course, a Catalog by Topic and Numbers That Depend on the Library Version
The playgrounds of a master's machine learning course have been joined by six playgrounds of a bachelor's course on programming AI systems in Python, and the site has become one...