ICT: A Week of Map Animation in a Minute, a Stations Map on OpenStreetMap and What Stood in the Browser's Way
An animation of ionospheric maps for a week took 18 minutes to build and was cut off at the proxy. Now days load and frames are drawn in parallel processes in the background — the same week in 62 seconds instead of 284. Why threads only made it worse, what BLAS threads cost, how the stations map moved to OpenStreetMap and what the content security policy and the cache broke in the browser.
After the breakdown of the orchestrator, seven changes went into IonFlow in a week, from 3 to 8 October. The main one concerns the ionospheric maps module described in the breakdown of the IonMaps methodology: an animation for a week no longer gets cut off and is built several times faster. The other changes are a stations map on an OpenStreetMap background, fixes to the content security policy and the cache that kept the browser from showing what was already there, and two corrections in the converters.
An animation the request did not wait for
A week of frames at 15-minute steps is 668 frames over 19 stations with kriging. On the server it took 18 minutes: 12 minutes loading the days one after another, another 6 drawing frames, and all of it on one core. The browser and the university’s proxy wait no longer than 15 minutes for an answer, so the request ended with the proxy’s 504 error page, and the finished animation was of no use to anyone.
Processes, not threads
Days now load in parallel worker processes, and frames are drawn in several more; the number of each is set in the configuration. Each process loading a day holds about 1.3 GB in memory for 19 stations, so the number of days loaded at once is limited by memory first rather than by the processor.
Threads did not work. Seven threads loaded a week three times slower than one, while seven processes were 4.6 times faster. Worker processes are started as a fresh interpreter rather than copied from the current one: the web process itself runs threads, and a copy of a multithreaded process can inherit a lock that no one is left to release.
The second trap is the linear-algebra threads. By default numpy starts a BLAS thread for each processor. Twelve workers under a container limit of 12 processors each opened a thread for every processor of the machine, the threads far outnumbered the cores, and the work took 7 times longer. Now each process gets a single BLAS and OpenMP thread — both in the Docker image and for workers started outside it.
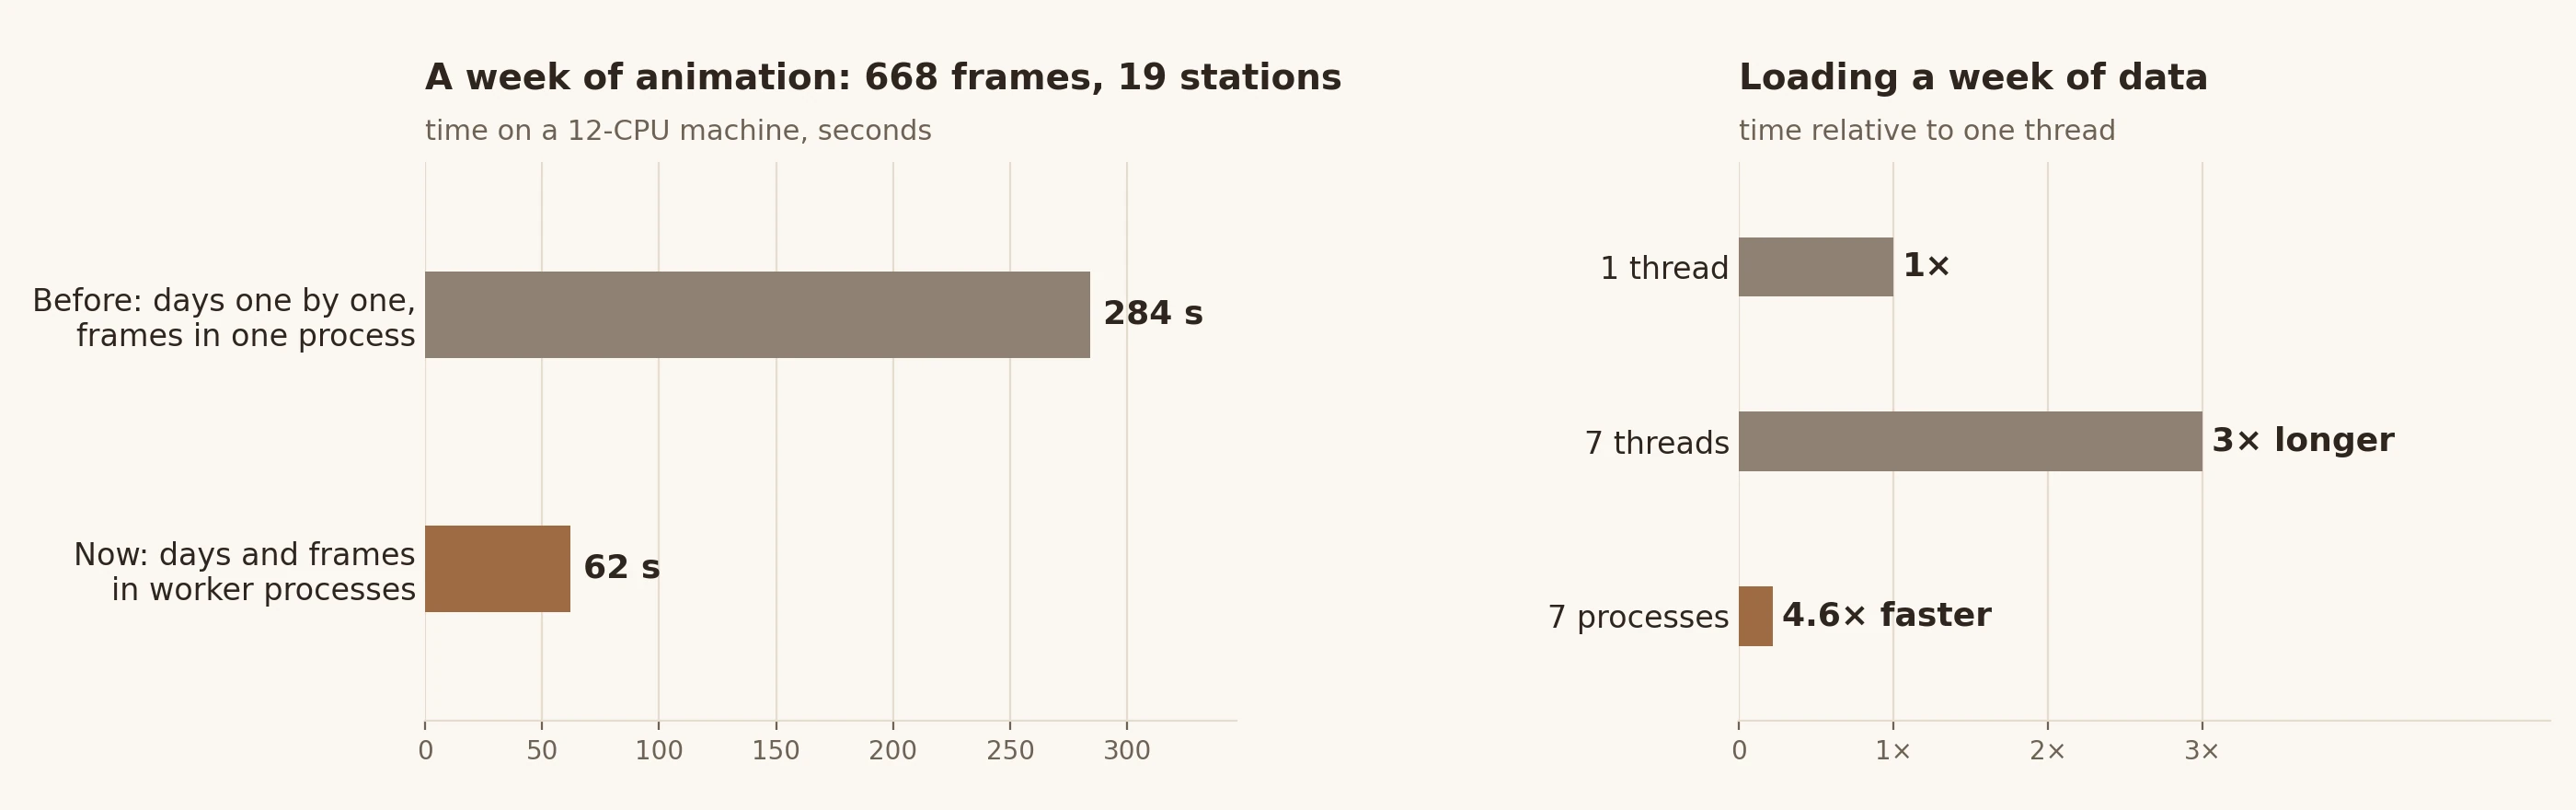
As a result, the same week builds locally, on 12 processors, in 62 seconds instead of 284. The parallel and sequential computations give the same result: the day summaries match, and for a full day so do the bytes of the GIF file.
In the background, with progress
Even a minute is too long for a single HTTP request, so an animation is now built as a background job. The IonMaps page sends the same parameters as before, gets a job number and shows the stage and progress: «Загрузка данных: день 4 из 7…» (loading data: day 4 of 7), «Отрисовка кадров: 200 из 667…» (drawing frames: 200 of 667). A bad request is still rejected at once, a repeated request with the same parameters picks up the job already running, a user can have no more than three active jobs, and finished files are deleted after a set time.
Animations are built one at a time — background and ordinary ones together — so between them they take no more cores than configured. The hub container is limited to 12 processors, and its memory limit is raised to 16 GB: the peak for a week was 5.1 GiB.
Errors became readable. If the server answered, its message is shown. If an HTML error page from the proxy came instead, a short explanation and that page’s title are shown, not the whole page.
Along the way an error in the form turned up. The opacity fields for the basemap and the field had a step of 0.05, and the default value was 0.28. The browser considered it invalid and would not let the map be built until the value was corrected by hand.
What the browser refused to show
Three errors this week concerned things the server already served correctly but the browser did not show.
- Video. The page plays a finished MP4 or WebM animation from a
blob:address. The content security policy (CSP) had nomedia-srcrule, so video fell under the generaldefault-src 'self', and the browser refused to load it. GIF worked only becauseblob:was allowed for images.media-src 'self' blob:was added. - Country outlines. Plotly loads the outlines of countries and coastlines for geographic maps from its own CDN. The security policy allows requests only to the site’s own server, and on a network without internet access the CDN cannot be reached anyway. The outline file is now downloaded when the Docker image is built, checked by SHA-256 and served with the static files.
- The cache. Static files went out without a
Cache-Controlheader. Browsers and caching proxies guessed a freshness period from the file’s age and after a deployment kept running the previous version’s scripts: the server already served the fixed stations map, while the browser still went to the CDN for outlines. Static files now go out withCache-Control: no-cache: an unchanged file is confirmed with a 304 response and not downloaded again.
A stations map on OpenStreetMap
The stations map shows the indexed RINEX stations and the metadata from the observation headers. It is now drawn on OpenStreetMap tiles through Plotly’s MapLibre map: it can be zoomed and fits itself to the stations on loading. The outline map stays as the choice for working without internet, and the browser remembers which background was picked.
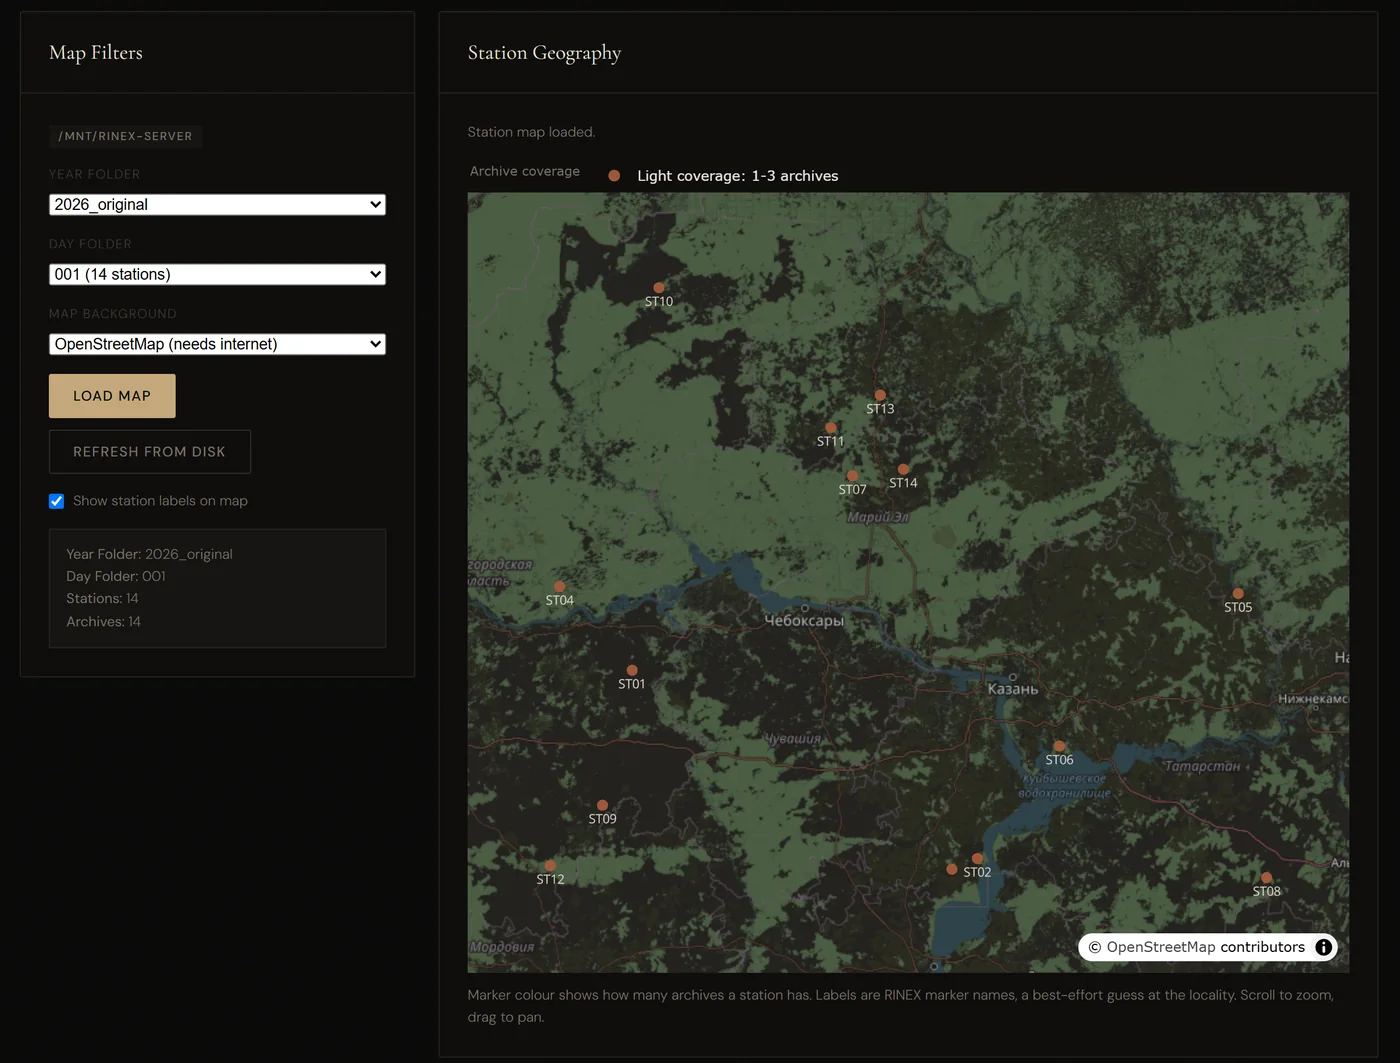
To get the background working, several conditions had to be met:
- Tiles load from
tile.openstreetmap.org, and the MapLibre map uses web workers fromblob:— both sources were added to the security policy. - Without a
Refererheader the OpenStreetMap tile server answers 403 «Access blocked», so the page sends it with thestrict-origin-when-cross-originpolicy — only the site’s address, without the path. - The label fonts with Latin and Cyrillic are downloaded when the image is built and checked by SHA-256 instead of being loaded from a third-party server.
- For a layer made only of labels, Plotly computed the text offset as NaN, and the whole map failed. The label layer was given invisible markers.
- If tiles fail to load, Plotly reports only «Map error.», although the stations are drawn. The page now explains what happened and suggests the outline map, and the stations table is built before the map, so a map error no longer hides it.
The legend moved from over the map to above it, the note under the map is translated, the dark theme inverts the tiles, and zoom and pan survive a redraw.
Converters
AbsTEC Suite gained the option «Очищать входные данные перед absolTEC» (clean input before absolTEC). With it, the absolute-TEC program runs on a copy of the station’s .dat files without the phase placeholder rows that keep the computation from converging on some stations. If the result is incomplete, the computation also runs on the original data, and the better of the two is kept, so no station gets worse. The option is off by default: that way an older image of the runner container never receives a parameter it does not know.
In the DAT ↔ Parquet converter, «Overwrite» was fixed. The converter takes it as “replace files that already exist in the destination folder”, but the hub additionally swapped the destination folder for the source data folder. With overwrite on, Parquet files landed next to the .dat files, and stale files in the real destination folder were never refreshed: after AbsTEC reruns, the converter skipped every station. The destination is now always the profile’s Parquet folder, and the form’s hint explains what overwrite does. No past job ran with overwrite on, so there are no stray files in the source folders.
Conclusions
- A long computation should not live inside an HTTP request: a background job with stages and progress survives any proxy timeout.
- For work done by the Python interpreter, threads can turn out slower than a single thread — here three times. Parallelism comes from processes.
- The number of BLAS threads should be set explicitly: twelve processes, each opening a thread per processor, worked 7 times longer.
- A strict content security policy breaks everything not listed explicitly — video from
blob:, outlines from a CDN, map tiles. Each such exception is better closed with a copy of the resource of one’s own, checked by hash. - Without
Cache-Controlthe browser decides for itself how long to keep static files and shows the previous version after a deployment.no-cachewith a 304 response costs almost nothing.
Availability
The orchestrator’s source code is open. The number of drawing and loading processes is set by the TEC_MAP_WORKERS and TEC_MAP_LOAD_WORKERS variables, and the address of a self-hosted tile server by TEC_MAP_BASEMAP_TILE_SERVER_URL; all of them are described in docker-compose.yml and .env.example.
- Source code: github.com/nikita-konkin/ict-hub
Tags
More project updates
ICT: Jobs That Survive a Restart, Windows XP in a Container and Deployment Without Manual Steps
Half a year of work on the ICT orchestrator: job events are kept in the database and survive a restart of the hub, the legacy program that computes absolute TEC runs in a real W...
ICT: from slant TEC to ionosphere maps — the IonMaps method
How the IonMaps module in ICT turns TEC-suite parquet output into regional maps of vertical total electron content: VTEC restoration from slant TEC, interpolation (linear, krigi...